Sample Size and Soup
By Kelsey Howell
You’ve developed a list of research objectives and determined the audiences you will be surveying for a new research study. One problem left―how many people should you sample?
Determining the correct sample size for survey research is a blend of art and science. The team at W5 is experienced in building successful sample configurations for many industries and use cases. However, if you have a strong theoretical background in the topic, it will allow you to approach the sample conversation more deliberately and express your research goals.

Margins of Error
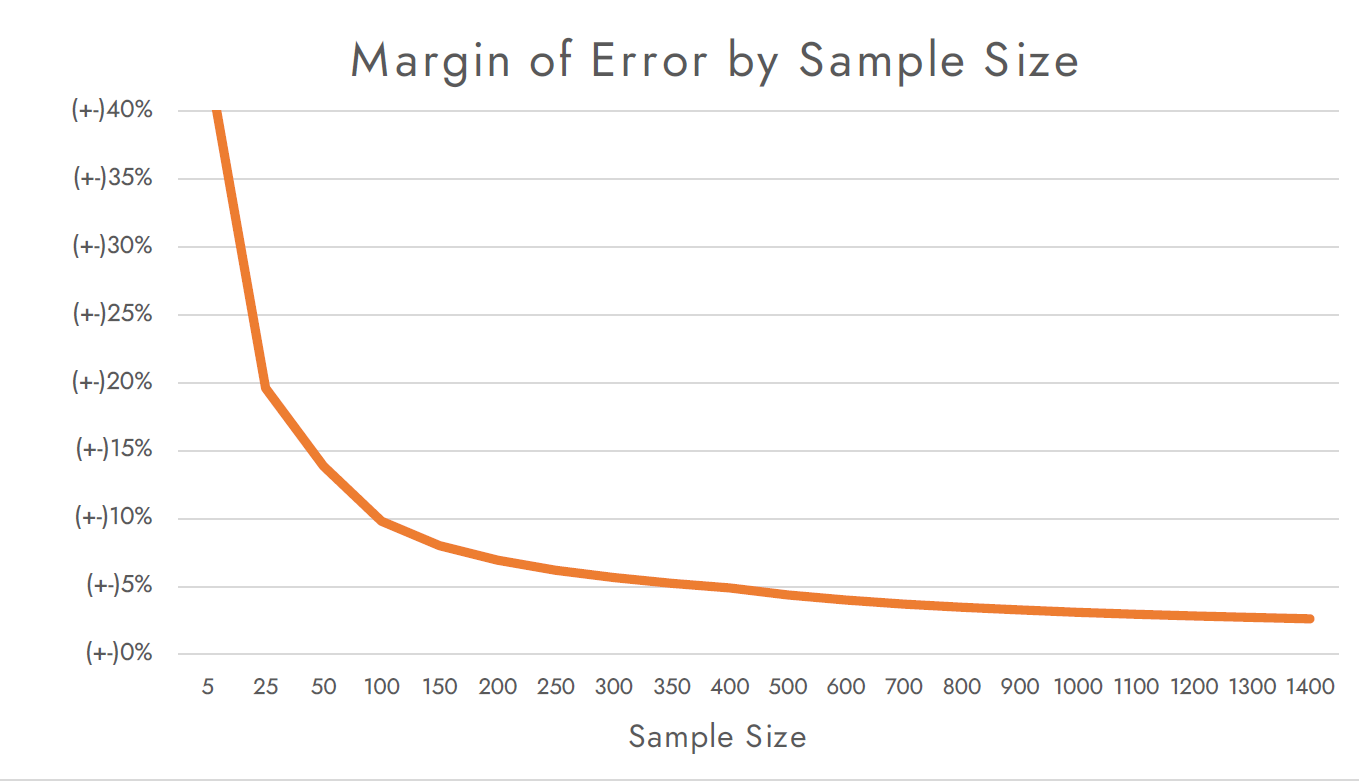
Mathematically, it is possible to examine the relationship between sample size and accuracy by looking at the margin of error your sample will allow. If the true “pot of soup” is 30% noodles, a sample of 400 units of soup will tell you that noodles comprise between 25% and 35% of the pot; this is a margin of error of +-5%. When we graph margin of error by sample size, we see the pattern observed from soup sampling:
A sample size of 400 is often considered the baseline for survey research, as it allows for high precision (+-5% error) at a cost-effective sample size. However, there are situations where larger and smaller samples are used.
Large Sample Sizes: Chunky Stew

Large Sample Sizes: Chunky Stew
In a varied stew, the entire ingredients list may not become clear until much of the stew has been eaten. A sample size larger than 400 is appropriate when you expect to see heavy variation in the population being surveyed, or when you are seeking to subdivide the data. Every demographic or behavioral data cut can be considered its own sample when measuring margin of error. The larger the sample, the more likely it is that true distinctions will emerge out of the statistical “noise” of margin of error.
For studies where these subdivisions are crucial to the research, such as segmentation, a sample size of 1,200 or more is common.

The Pot of Soup
If you’ve ever cooked a pot of soup, you intuitively understand sample size.
A whole pot of soup is a varied mix of ingredients, much like the varied group of people from whom you may be seeking opinions.
To understand how the soup is shaping up, we could drink the entire pot, but this would be inadvisable and very costly (for one’s digestive system, at least). Instead, we can get a sense of how the soup as a whole tastes by sampling a little bit of it at a time with a spoon.
The size of this spoon is your sample size.
One might initially assume a linear relationship between the accuracy of a soup sample and the size of spoon used to collect the sample. After all, the bigger the sample, the closer it approximates the taste and ingredients of the whole pot, right?
In practice, however, the sample size of one cup will probably be as accurate as the sample size of a pint or quart, but will get you much more accurate results than the sample size of one teaspoon, which might not even capture every ingredient in one bite.
This is true regardless of the size of the pot of soup*.
Small Sample Sizes: Smooth Tomato Soup

In a tomato soup, it’s possible to get a good idea of the whole meal in one teaspoon. A sample size smaller than 400 may be appropriate when you expect to see little variation in the population being surveyed and the sample is difficult to obtain. This is most common in B2B studies, where the behaviors of highly specialized professionals may be largely homogenous.
In Summary:
· The larger the sample size, the more accurate your sample, but this will hit a point of diminishing returns
· The minimum sample size in marketing research is 400 respondents
· Conditions of your specific study may merit a smaller or larger group of respondents
Advanced Soup Analysis: Confidence Interval
Sometimes, you just get a spoonful of noodles.
Around 5% of possible samples that can be gathered in research will be outliers falling outside of the usual error range found for a particular sample size. For example, at sample size 200, 5% of possible samples will vary more than +-6.9% from an accurate result. This principle is known as the 95% confidence interval and is used widely throughout market research. Carefully setting research quotas can limit, but not entirely eliminate, the chance of a bad sample.
A 99% confidence interval is occasionally used in cases requiring extreme data precision and large sample sizes, such as medical trials. 100% confidence is impossible to achieve for most market research, as it would require every single eligible person to take the survey, à la the United States Census or internal workplace studies.
*This is a generalized statement. Population size will begin to affect sample requirements at very low population sizes, but the phenomenon is rarely relevant to marketing research. Small population sizes are more common in internal workplace studies.